1 Spring Cloud Sleuth
https://github.com/spring-cloud/spring-cloud-release/wiki/Spring-Cloud-2022.0-Release-Notes
1.1 目前调用链路存在的问题及解决方案
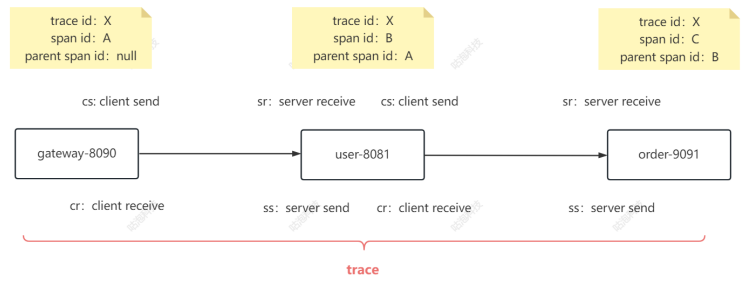
存在的问题:整个微服务调用的链路是怎么样的?以及调用发生了问题该如何定位?每个服务调用到 底花了多长时间?
解决方案:链路追踪
常见的链路追踪产品:Spring Cloud Sleuth+Zipkin、SkyWalking、阿里鹰眼、Jaeger、Pinpoint、 大众点评Cat等
1.2 Sleuth介绍
https://spring.io/projects/spring-cloud-sleuth#overview
SC Sleuth是通过扩展Logging日志的方式实现链路追踪的。
1.3 微服务整合Sleuth
(1)引入依赖
1
2
3
4
| <dependency>
<groupId>org.springframework.cloud</groupId>
<artifactId>spring-cloud-starter-sleuth</artifactId>
</dependency>
|
(2)写配置
1
2
3
4
5
6
7
| spring:
sleuth:
sampler:
probability: 1.0
logging:
level:
root: debug
|
1.4 Tracer
如果想要通过代码方式获取到traceid、spanid等,可以查看brave包下的Tracer类
1
2
| tracer.currentSpan().context().traceId()
tracer.currentSpan().context().spanId()
|
2 Zipkin
https://zipkin.io/
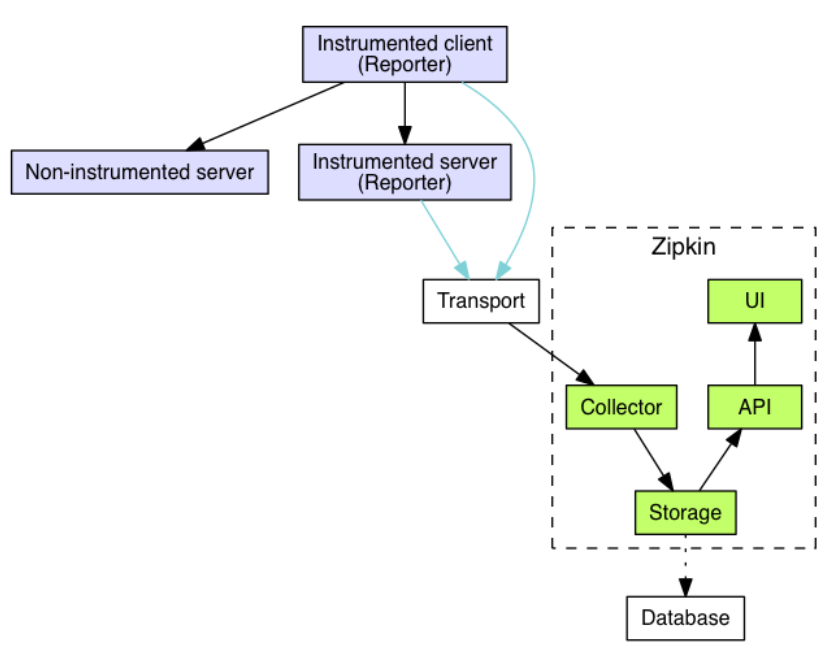
工作流程:
1
2
3
4
5
6
7
8
9
10
11
12
13
14
15
16
17
18
19
20
21
22
23
24
25
26
27
28
29
30
31
32
33
34
35
36
37
38
39
40
| ┌─────────────┐ ┌───────────────────────┐ ┌─────────────┐ ┌──────────────────┐
│ User Code │ │ Trace Instrumentation │ │ Http Client │ │ Zipkin Collector │
└─────────────┘ └───────────────────────┘ └─────────────┘ └──────────────────┘
│ │ │ │
┌─────────┐
│ ──┤GET /foo ├─▶ │ ────┐ │ │
└─────────┘ │ record tags
│ │ ◀───┘ │ │
────┐
│ │ │ add trace headers │ │
◀───┘
│ │ ────┐ │ │
│ record timestamp
│ │ ◀───┘ │ │
┌─────────────────┐
│ │ ──┤GET /foo ├─▶ │ │
│X-B3-TraceId: aa │ ────┐
│ │ │X-B3-SpanId: 6b │ │ │ │
└─────────────────┘ │ invoke
│ │ │ │ request │
│
│ │ │ │ │
┌────────┐ ◀───┘
│ │ ◀─────┤200 OK ├─────── │ │
────┐ └────────┘
│ │ │ record duration │ │
┌────────┐ ◀───┘
│ ◀──┤200 OK ├── │ │ │
└────────┘ ┌────────────────────────────────┐
│ │ ──┤ asynchronously report span ├────▶ │
│ │
│{ │
│ "traceId": "aa", │
│ "id": "6b", │
│ "name": "get", │
│ "timestamp": 1483945573944000,│
│ "duration": 386000, │
│ "annotations": [ │
│
└────────────────────────────────┘
|
2.1 下载搭建Zipkin Server
(1)下载链接:https://repo1.maven.org/maven2/io/zipkin/zipkin-server/
(2)启动zipkin server
1
| java -jar zipkin-server-2.23.2-exec.jar
|
(3)浏览器访问9411端口
2.2 微服务整合Zipkin客户端
(1)引入依赖:此时就不需要单独的sleuth依赖了,因为zipkin中包含了sleuth
1
2
3
4
5
| <dependency>
<groupId>org.springframework.cloud</groupId>
<artifactId>spring-cloud-starter-zipkin</artifactId>
<version>2.1.3.RELEASE</version>
</dependency>
|
(2)写配置:注意zipkin和sleuth的父级配置项都是spring
1
2
3
4
5
6
| spring:
zipkin:
base-url: http://localhost:9411
sleuth:
sampler:
probability: 1.0
|
2.3 Data Model
https://zipkin.io/pages/data_model.html
向Zipkin报告数据的最流行方式是通过HTTP或Kafka,尽管许多其他方式存在选项,例如Apache ActiveMQ,gRPC和RabbitMQ。
2.4 持久化到MySQL
(1)执行mysql.sql
https://github.com/openzipkin/zipkin/blob/master/zipkin-storage/mysql-v1/src/main/resources/mysql.sql
(2)重启zipkin server,设置其数据持久化方式为MySQL
1
| java -jar zipkin-server-2.23.2-exec.jar --STORAGE_TYPE=mysql --MYSQL_HOST=127.0.0.1 --MYSQL_TCP_PORT=3306 --MYSQL_USER=root --MYSQL_PASS=root123 --MYSQL_DB=db_zipkin
|
2.5 持久化到ElasticSearch
(1)下载es
https://www.elastic.co/cn/downloads/past-releases#elasticsearch
(2)启动es
以windows环境为例,解压es的压缩包,来到bin文件夹之下,执行elasticsearch.bat文件,默认会监 听在9200端口
(3)重启zipkin server,设置其数据持久化方式为es
1
| java -jar zipkin-server-2.23.2-exec.jar --STORAGE_TYPE=elasticsearch --ES_HOSTS=127.0.0.1:9200
|
3 Micrometer
在Spring Boot 3.X中Sleuth被替换成Micrometer
https://github.com/spring-cloud/spring-cloud-release/wiki/Spring-Cloud-2022.0-Release-Notes
https://docs.spring.io/spring-boot/docs/3.0.0/reference/html/actuator.html#actuator.observability
https://micrometer.io/docs/observation